

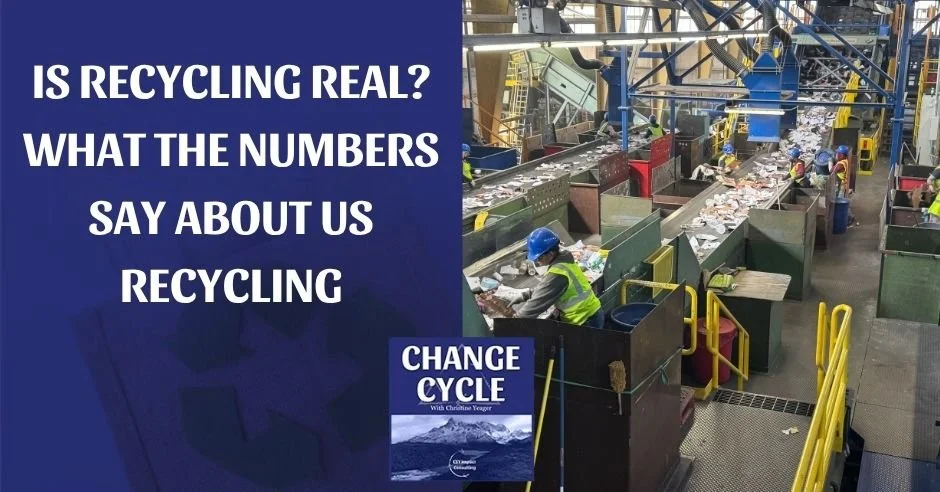
With headlines claiming that only a small fraction of plastic ever gets recycled, it is natural to question: is recycling real, or is it just a persistent myth? In this episode, Christine Yeager breaks down the complex reality behind residential recycling data, waste characterization studies, and the critical distinction between collection rates and true recycling rates. From cardboard and aluminum cans to PET plastics and state deposit return schemes, we unpack what the data says about local infrastructure and market dynamics. Discover how Extended Producer Responsibility (EPR) regulations are reshaping the circular economy and what steps are necessary to drive meaningful progress across the country.
—-
Watch the Episode here
Listen to the Podcast here
Is Recycling Real? What The Numbers Say About US Recycling
Unpacking The Recycling Debate: Collection Rates Vs. True Recycling
Welcome back to the show. A couple of episodes in the past, and I think also some of the ones that will be after this, and just in life. I get this question all the time. Tell me that when I recycle, it is worth something, that it matters. There is a belief that recycling is not real or that it is not working, and there are actually recyclers across the globe. People have read that maybe only five percent of all the plastic in the world is getting recycled. People have seen documentaries. Some people have watched their trash trucks throw recycling bins directly into the same trash truck as their regular trash. I believe in recycling.
A lot of the people I interview believe in recycling, but it got me thinking, maybe it is worth having a dedicated episode. Is recycling real? How do we know if it is real? What is driving the myth? What does the data say? Obviously, the answer from my point of view is that yes, recycling is real. Let us unpack what that really means. Quick vocabulary check, recycling rate versus collection rate.
A collection rate measures what is picked up, like what is in your curbside bin and brought somewhere or collected anywhere else and brought to a place to then be sorted and recycled, versus a recycling rate, which is like what actually ends up becoming something else, whether it is going to like a more durable good or actually bottle-to-bottle or whatever the end process is. It is actually turned into something that can be reused and resold on the market as post-consumer cycle content or as post-industrial cycle content. It might just be used right back into their operations.
Unomia and Ball State's recycling rate very clearly calls out the difference between this collection rate and recycling rate. It is also like what EPR is trying to drive in markets, something is actually recycled. There is a capture rate, the share of recycled material that is actually making it into the recycling bin. Let us say you have a collection rate of aluminum cans, which is that we are collecting, let us say, 60% of the cans that are being sold into the record place. How much is coming through that house and then actually also being recycled might be a different number than the state average of what is actually being collected.
This is the share of recyclable material in a household. The Recycling Partnership found that among households with access, 59% use the service, for example. Those who use it put about 57% of the things that are actually considered recyclable in the bin. You get this type of information from waste characterization studies. It is an average, for sure. A closed loop versus open loop recycling. Closed loop is that a can becomes a can, a bottle becomes a bottle. This is how people talk about it. An open loop is that a material becomes a different, often lower-value product.
Somebody described recycling as a spiral instead of a loop so that it can become a sheet that shows up in a car that becomes something else, or what have you. People will call it lower value, but sometimes it is just more durable, longer value, which means it can sometimes be harder to go back to the same thing again.
Recycling refund, deposit return scheme, or bottle bill. These are all kind of used together. It is a refundable deposit on a beverage container that is returned when the consumer brings the container back and then gets that, like $0.10 or $0.5 back from what they have bought. Let us dive in. Now, I have said this before on this podcast, but it has been a while. The latest national recycling data from the EPA is from 2018. My son was born in 2017, and he is now nine. It was a while ago, right? It is what the EPA has.
It says that 292 million tons of municipal solid waste were generated and 69 million tons were recycled. That is about 23.6 percent, and 25 million tons were composted. That is a rate of about 8.5%. About 32% of municipal solid waste was diverted from landfill, 50% was landfilled, and 11.8% was combusted with energy recovery. A waste combustion process. Waste energy. The Recycling Partnership in 2024 reports that only 21% of residential recyclables are actually recycled. Lower than older estimates because the new method tracks material through the system and includes multifamily homes and film flexibles.
Comparing Material Value: Paper, Aluminum, Glass, And Plastics
These numbers are not necessarily contradictory. It is just like different definitions of what they are capturing and different time periods. How do each material stack up against each other? American Forest and Paper Association, AFNPA, reports on paper numbers. They say that cardboard and paper overall, so hardboards, are at like a 69% to 74% rate. 2024 data, paper is like 60% to 64%. I have heard of companies like Pratt that would like to own MRFs, and I think almost everything that they sell has some amount of recycled paper in it, recycled content in it.
There is value to these paper companies in owning the MRF just to get back the cardboard or the recyclable paper. Aluminum cans are like 43%, but most of those are actually closed loops going back into cans. The average can, aluminum can, is 71% recycled content. Aluminum is very high value. Car companies who use aluminum, there is enough value that recycling of like the use of aluminum in cars and planes and all of this stuff is all high value enough that most of that is also captured.
Glass bottles. This is cited from the Aluminum Association and the Can Manufacturers Institute as having almost a 40% recycling rate. Sometimes that is not going back into bottles because there is not a lot of glass bottle manufacturing in the United States. A lot of it is international. Sometimes it goes into the road base or into something else because it is too heavy to transport to where they are making the bottles. We get to plastic. PET bottles have a decently high rate of 30% according to NAPCOR. I cannot remember what that acronym stands for right now. All plastics from the EPA in 2018 is saying like 8.7%.
Also beyond plastics shared a number of 5.6% for all plastics nationally. That is where that like 5% number is coming from. That is a lot of numbers. The point is, there is some recycling happening. It is just that not every plastic is made the same, and not every plastic has the same rate. Not every plastic is necessarily recycled curbside versus another pathway. As you can see, including PET bottles, all of those rates are above 30% of recycled material. Cardboard, paper, aluminum, glass, PET, these are all what we would call high-value items from a recycling stream standpoint.
They have pretty decent numbers. They are also a large-ish percent. I am pretty sure a large percentage of the waste is municipal solid waste overall. Yeah. For example, aluminum in 2024 was priced at $1,300 per ton. PET was priced at $215 per ton. Glass was $23 per ton. This is like buying the scrap of that material. You can see how much more valuable aluminum is. When we talk about the circular economy, this is what I mean. You need an economic value to the circularity of the product or the material in order for it to actually get recycled.
You need an economic value to the circularity of the product or the material in order for it to actually get recycled.
The Association of Plastics Recyclers, obviously this is the group that is tackling plastic recycling in the United States, but it is like MRF operators and like different folks that are trying to recycle plastic. It is also in the market for recycled plastic resin manufacturers. They talk about how a consistent national plastic rate is difficult to calculate because the US does not require comprehensive reporting across MRFs or all of these things. You will notice in the EPR bills that have been passed, a lot of times there is this commentary on a need for better data and how the EPR bill is trying to alleviate this lack of data.
Geographic Disparities: High-Performing States And Deposit Return Schemes
Where in the United States are things actually getting recycled? All of this is most of the data that I could find is like pre-EPR because we have only been in operations in Oregon and Colorado for like a year, year and a half. There is not a lot of post-EPR data available yet, because it is hardly post-EPR. I have talked about this report before. 50 States of Recycling report shares that, of the top ten states, recycling rates in these states are Maine with 65%, Vermont with 51%, and Massachusetts with 48%.
All three of those have a deposit return scheme. Iowa, 45%, also has a deposit return scheme. Oregon, 45%, same thing. New York, 44%. California, 41%. Michigan, 40%. New Jersey, 39%. Connecticut, 39%. These top ten all have deposit return schemes, which is driving a lot of their recycling rates. We have known that, but they all have caps also. They are not really growing. They are leveling out. They are not improving their rates because they have this, not all of them, most of them, the unredeemed deposits become a budget line item for the state.
The bottom ten recycling rates are, again, older data. It is like the 2021 data is West Virginia with 2%, Louisiana with 4%, Alabama with 8%. Tennessee, Alaska, South Carolina, Mississippi, Texas, all of those have like 6% to 8 % recycling rates. Colorado was even at like 11%. Colorado has moved up to closer to 22%, a different section. As a later home, Colorado's needs assessment showed that statewide diversion from landfill was 15.7 % in 2024, which is roughly flat from 2019.
The recycling partnership's residential and has some rates and only California, Connecticut, New York and Oregon hit a 30% for residential recycling. Alabama, Louisiana, Mississippi, Montana, and Nebraska are below 10%. I guess the point of sharing all of these numbers, which you are not going to memorize all of these, but the states that have had a deposit return scheme for a long time have inherently higher recycling rates. Some of the states that have the lowest recycling rates are also some of the states with a lot of other types of infrastructure challenges and have other generally lower-income communities, things like this.
There is this disparity in wealth, and there is just disparity in recycling rates. If there is no infrastructure, it can be cheaper for somebody in Alabama or Louisiana who picks up recyclables to take it to a landfill instead of the work of finding somebody to buy the bale at the end of the line. When people are saying, like, is recycling fake, it is unknowingly important to ask, well, where are you? In what community? There are places, coastal Louisiana and Alabama, where people are investing in recycling.
If there is no infrastructure, it can be cheaper for somebody who picks up recyclables to take it to a landfill instead of finding a buyer
One of my early guests was Osprey Initiatives, and they operate in that community, and they are recycling everything that they collect or that they can. They try to recycle everything they collect and what they can take. They have reputable MRFs that they take their material to, and they know where it is going, and there are PET buyers in those communities. There are people who want that material. That is what I am saying. There are plastic recyclers in that area.
Evaluating Infrastructure: State Needs Assessments And Extended Producer Responsibility
If it can be prioritized in that funding budget, that area, or if it is being sponsored maybe by a corporation, it is likely that it is being taken somewhere where it is actually being recycled. It depends. The How2Recycle label has started to build this database of what that means and how you can find what your community can take. That is actually being recycled. With many of the EPR bills needing assessment, for some of these states that are looking into EPR, there have been needs assessments done to say, where do we stand as it relates to recycling infrastructure and what needs to change in order to get us to a higher rate.
In Maryland, HDR did a needs assessment, and they found the current packaging and paper recycling rate in Maryland is 34%. For commercial, like B2B, it is 39%. For single-family homes, it is 30%. For multifamily homes, as with most of this, these types of needs assessments have found that it is closer to 16%. In Maryland, 89% of single-family homes have access to curbside. They are not all using it, probably because they do not believe it works. Not really. That is not the only reason, but you know what I mean.
Anyway, in New York recently, I think they are putting out more data, but this data is from April of 2026. They found that the current packaging and paper rate was 30%, and that 100% of New York has curbside access. 76 % of packaging and paper is accepted curbside, but obviously they only have a 30% rate, so people are not all using it. As I said, it is a deposit-return scheme state, so there is some lift coming from the deposit-return scheme process. HDR in the Colorado needs assessment, and UNOMIA found that covered packaging and covered entities were between 22% and 28%.
That is where I got that 22%. This is just like the material that is considered covered in the Colorado EPR. It found that 68% of single-family households and 60% of multifamily households have access to curbside. Those are like real numbers where 30% does not mean, I do not know who you are, if that sounds like a lot or not to you. Given that some states are at 4%, and it is well above the 5% that we are saying is recycled for plastic.
The point is that these are real numbers from detailed assessments being done to find out what is actually being recycled. Somebody had to pay for these assessments to be done, and also these numbers are across all different types of material. There is still the reason why your fees are structured the way that they are in EPR is because not everything is actually being recycled across all material types, which is why some things are sort of more expensive than others. All of this is like food for thought, saying that recycling is real.
CalRecycle did a study in April 2025 as their needs assessment as a part of the EPR bill SP54. They surveyed and looked at processors serving 93% of the population. I tested two things, whether materials are collected curbside and whether they get sorted into a sellable stream. That is, what is actually being sold off and considered moving into a responsible end market. 94% to 100% of counties served had things sorted. Cardboard, office paper, they were all sorting the material, but not all of the materials were going somewhere. Some things were failing.
The things that were falling short were some of your typical deemed harder-to-recycle materials, like PVC films, like flexible plastic, and things like clean molded fiber, mailing pouches, in some cases, cartons. Those are the players you would expect to show up as falling short, but there is still quite a bit of material actually being recycled. 29% of Californians can put film in a curbside bin, and molded fiber is accepted for 94% of the population. Surveyed facilities sort neither into a validated outflow.
Closing The Loop: Market Demand And End-Market Realities
They are accepting it, but they are not necessarily sorting it properly to then send it somewhere to be recycled, which is probably a shortcoming in their sorting technology, not necessarily a statement on the market, because we know there are people, there are companies out there that are willing to buy like, flexible film, for example, of certain materials. Across all the needs assessments, I bring these up again because these are richer data on what is actually happening in the recycling stream in the United States. They all say that roughly 30% of packaging and paper is captured.
With a well-funded system, you could get to 50% to 60%. That is not a myth. That is real and an identified gap. Is that enough information to say it is real? It’s because those places that are investing in needs assessment are probably some of the places that have better infrastructure. The test really falls into whether something goes in a bin, a manufacturer pays for it, and makes something new.
By that test, fiber, nearly half of recycled fiber goes into container boards. New boxes, recycled fiber is 44% of all fiber US mills consume. For sure, by fiber, that is paper. Paper is 44% of US mills. Recycled fiber becomes 34% of what is put into new paper. Almost every corrugated box has some level of recycled content in it. Aluminum, as we know, has a lot of value. $1,300 per ton. People are willing to buy that and reuse it to the tune of 96.7%. Recycled can material goes back into cans. It is also a high energy-intensive situation, like alternative conversion.
I know they are working on making that clean energy to heat it. For PET, US reclaimers bought billions of pounds in 2024, and bottle applications are 60% of domestic recycled PET demand. If it is available, if it is food grade, people are willing to buy it. Companies are willing to buy it, but they are competing against downgrading to, like, polyester for your clothing or textiles or flooring or other things that are willing, that do not require as high a quality of material and as high a quality bale.
You and me and Ball put the value of material diverted from landfill at 2.6 billion per year, and then closer to 6.5 billion per year being thrown away. The answer is that if you say yes to that, it does not mean that the current system is sufficient. The question is not whether recycling works. It is for which materials, where, who is paying for it, and where it is going. It is like a much more nuanced answer. Unfortunately, if you are not in an EPR state, the answer is that you have to either call your MRF or check the How to Recycle website to find out what your MRF will actually take, or the TRP website. There are lots of resources that I will list.
The question is not whether recycling works. It is for which materials, where, who is paying for it, and where it is going.
Why won't this myth die if we have a lot of data and almost everybody in my circle is working on this problem, and maybe not in your circle, but maybe if you are tuning in to this show? Why will this myth not die? The most visible material is the weakest performer. When people say recycling, they picture plastic, and plastics overall sit, on average across all material types, in the single digits of how much material is actually being recycled, percentage-wise. Not all plastics are made the same. If you check the Association of Plastics Recyclers website, they would say the same thing.
It depends on the value of the material, how it can be reapplied, and how easy it is to be reapplied. There is lots of nuance in how the plastic is made that can directly determine whether or not it can be reapplied in the same way or what have you. It is true that a lot of companies made a lot of commitments and a lot of statements about recycling as a solution, with some investigations done that identified gaps. We know that the recycling system is broken in some ways, not in all ways. NPR Frontline did a 2020 investigation and documented the plastics industry's promotion of recycling despite internal doubts about the economics. There is definitely information out there that the industry was not maybe as forthcoming about the realities of recycling as they could have been.
There was a big, everyone brings up that in January 2018, or they bring up that China will not take our trash anymore. That was around January of 2018. They banned imports of mixed paper and mixed plastic and set a 0.5% contamination limit on other recyclables. It basically is forcing a more consistent bale of material in order to export it so that they do not have to take the burden of sorting out the contamination. A lot of people just heard that China is not taking our trash anymore, and so all of it is going to the landfill. There is measurement chaos.
Dismantling The Myth: Measurement Chaos And Consumer Confusion
There are different groups measuring the success of recycling at different points with different denominators and different years, and there is no consistency, and the EPA has not put out anything new since 2018. It is impossible to put out a consistent plastics rate nationally. Even Colorado had three different rates that I just shared, 11%, 15.7%, and 22% to 28%. It feels like there is a lot of fake information out there because there are all these different percentages, and nobody can really trust the numbers of what is coming out.
It is not necessarily a flaw in the fact that something is being recycled or not. It is that there is not a standard way to measure all of this, and nobody has invested enough to make it a national average. There has been a lot of confusion throughout the years, and people have been trying to make this change for a long time. The chasing arrows on the bottom of your package. I studied resins in college, so I have always known that the numbers were just the resin codes, what they were, like whether or not they were recyclable. They have always had these chasing arrows around the resin codes that make people think that they are, like, please recycle me labels.
The most visible material is the weakest performer. When people say recycling, they picture plastic, and plastics overall sit in single digits.
There has been a push over the years to move away and move to, like, a solid triangle, but you still see it around the resin codes. SV-3343 was California's attempt to regulate that, but it has been paused. It is not necessarily, it is not taking effect this month. That resin code chasing arrows causes a lot of confusion. Because of all of this, you have this other reason that makes recycling not real or degrades the amount that is recycled is because of the fact that people think it is not real and that recycling is a myth, that they do not participate.
There is a lot of leakage happening at the household level, with like 59% participation, meaning people are not using it if they have access. They do not know what to put in it. They are wish-cycling. There is just a lot of leakage happening at the bin because people do not know what to do. They are confused, and they do not trust it. It is easier to just throw it in the trash. I will concede that most plastics beyond PET and HDPE are currently in the market through curbside, not really flagged as high-value plastic. That is not the case in a lot of B2B commercial recycling operations because it is a lot more streamlined in how they are collecting it. They have a lot more control.
There are fewer people that they are educating. A lot of distribution facilities or retailers or other folks will sort out cardboard, polystyrene, flexible film, like some of these traditionally harder-to-recycle materials, and they will find someone to come pick it up for them and recycle it because there is value to them in that way. The curbside, that is where there are so many different types of packaging that the ones and twos, the PET and HDPE, are generally accepted and recycled, and the three through seven are harder to sort, less likely to be put in the bin, and it is harder to find a good-quality end market for the MRFs.
The higher value the MRF has for the material, the further to the answer, yes, is it being recycled is. That is what EPR is trying to change is the economics of all of the types of materials so that they will be recycled and there will be an end market. I would say the national performance on recycling has stagnated and/or slipped. 2020, we saw a ton of decline in recycling, but it is, I think part of that is like, it is stale. There is not a lot of, well, there is some investment happening that takes a while for some of that investment to actually drive change in recycling rates.
It is true that collection does not equal recycling. Just because they have collected a teak and put it into the Murph, sorted it, does not mean that the bale at the end of the line is being sold to someone who is going to recycle it. However, I bet if you call it an Astro Murph, which nobody is going to do, they would tell you if it is or is not. You can tour your Murph, probably, because they are generally trying to find a market. It is just a matter of how expensive and hard it is to find the market.
People think recycling is not real and that it is a myth, so they do not participate and wish-cycling happens.
The Future Of Recycling: Audited Data, Policy Shift, And Next Steps
What to pay attention to, EPR reporting in Oregon, Colorado, and all these other states. We are going to start to see much more comprehensive data on what is being recycled, as these service providers are asking for reimbursement for the material that they are actually recycling. I would also keep an eye on SV343 in the junction. Is it going to hold? That decides whether recyclable on a label is specific to the state of California or continues to be sort of in line with the green guides. What is likely to change?
Hopefully, the debate of whether it really shifts from opinion to audited data and that we can start to say yes, and there is less confusion about what is actually recycled, at least in the APR states. Companies should still plan to substantiate any recyclability claim, and, like that, it matters not just the material but also the package. I would just like to embrace the answer to the question is recycling real? Yes. Do I think a mindset shift instead of asking, is it real? Is this material being recycled where I am versus sorting peanut butter spread, asking the question?
Maybe pull your top five packaging SKUs in your portfolio and check each against the strictest recyclability test for where you sell and see if it is happening. If it is meeting the answer, yes, it is recyclable in the places that you sell it. Look, I think there is a lot of waste that ends up in landfills that could be recycled. The technology exists for the material to be recycled. There are people who are building their business on buying post-consumer recycled content or even selling it. The data proves recycling works even though the system is not necessarily designed and funded to make it work.
The technology exists for the material to be recycled. There are people who are building their business on buying post-consumer recycled content.
There are optimizations that we need to make, but there is still data that proves that recycling is happening and that it works. Most of the country has not built a perfect system yet. There are gaps that happen in all of the states. Even California has gaps to fill. Change is uncomfortable, and recycling is not perfect, but change is uncomfortable. Recycling is not perfect, but I do believe that we are seeing progress in the right direction and voluntary and involuntary investment in recycling across the United States to make it very real in a much bigger, larger-impact way. Thank you.
Important Links
National Overview: Facts and Figures on Materials, Wastes and Recycling
Cardboard recycling rate plunges following AF&PA’s calculation revamp
4 insights on the state of PET recycling and rPET in packaging
Bottle recovery rates dropped in 2024, but other plastic rates rose
How Big Oil Misled The Public Into Believing Plastic Would Be Recycled
Western Slope communities’ efforts to reduce landfill waste lauded in 2025 statewide report
Maryland’s recycling needs assessment sheds light on possible EPR impacts